7.4. Block 1 Test Excavations at Maymeja Q02-2
Test excavations in the Maymeja area of the Chivay source occurred at three units. Test Unit 1 in the Block 1 quarry area was placed on the north side of Maymeja in a corral with ample evidence on the surface of obsidian reduction, but the test unit results were of limited value and they will not be presented here. Test Unit 2 was placed in the debris pile associated with the Q02-2 Quarry pit. Test unit 3 was placed in a mound of flaked obsidian that appears to have been a quarry workshop. These latter two test units will be described in more detail.
7.4.1. Q02-2, Test Unit 2
The broader context of Q02-2 and a map of the quarry pit vicinity are shown in the Early Pastoralists section of Chapter 6 (see Figure 6-45). Few concentrations of cultural artifacts were found on the surface of the quarry pit that would have aided in selecting a location for the 1x1m test unit. There was a great quantity of fractured obsidian, but as will be described below, the test excavation showed that geologically fractured obsidian was the rule and culturally produced flakes were rare in this area. Lag gravels consisting of small, 1-5cm obsidian nodules were observed in a very light tephra-rich soil that formed the context of the quarry pit. The area had little evidence of cultural activity except the excavated pit itself, the associated debris pile, and the greater concentration of dozens of 5-15cm nodules in the bottom of the quarry pit.
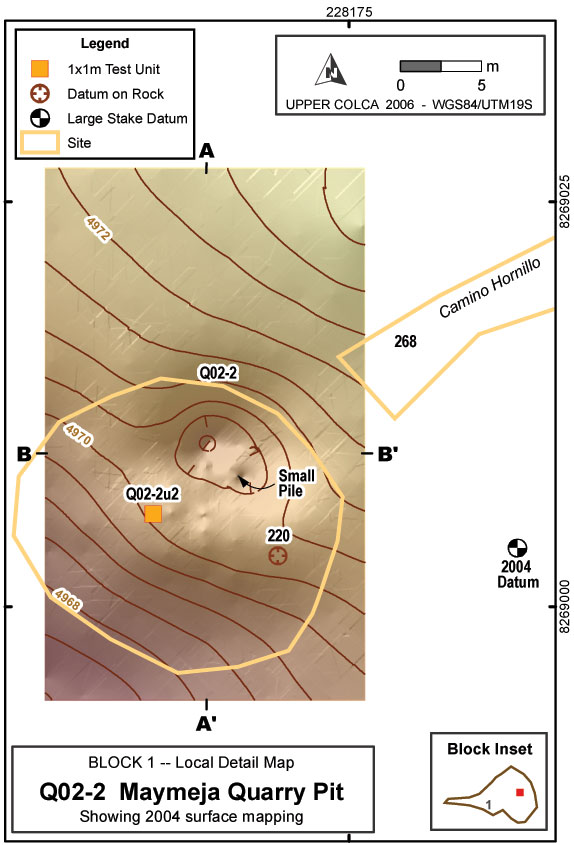
Figure 7-4Map of quarry pit showing topographic surface acquired using a total station.
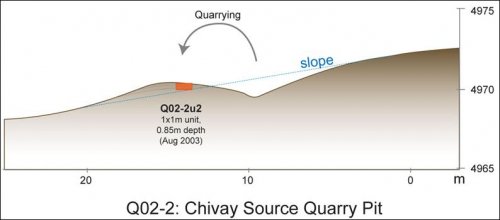
Figure 7-5. (a) Perspective view of quarry pit, (b) Perspective view bisected with an inferred natural slope.
The Q02-2 pit is a depression that measures approximately 4m by 5m, with a depth of 1.5m despite evidence that this pit, excavated into sandy soils, has collapsed margins and has been partially refilled over the years (Figure 7-4). If the area that deviates from the natural slope, including the accumulation pile downslope, is included the disturbed area grows to measure 10m by 12m. Oblong quarry pits ringed by semi-circular debris piles are described at obsidian sources in central Mexico by Healan (1997) and by Darras (1999: 80-84), although this quarry pit falls in the medium size range by Mexican standards.
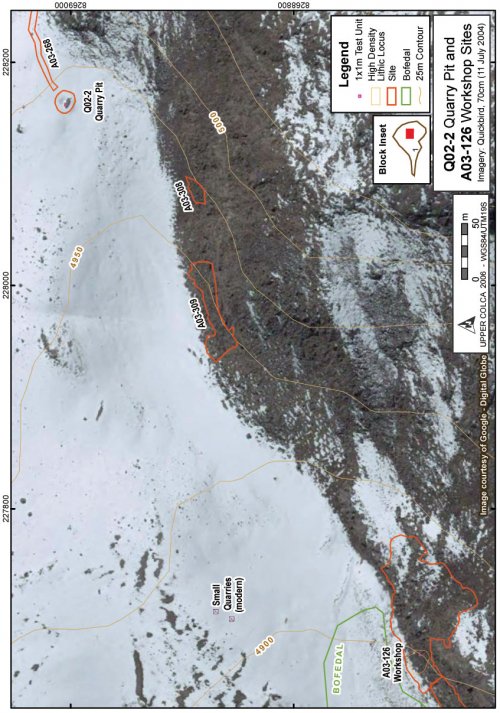
Figure 7-6. The quarry [Q02-2] and workshop [A03-126] are 600m apart. In this image snow blankets most south-facing slopes but the quarry pit debris pile is visible protruding through the snow mantle.
The deepest part of the Maymeja quarry pit at Chivay tends to retain snow (see photo in Figure 6-45), and in the southern half of the quarry depression it was evident that more recent disturbance had occurred. A small mound of light, sandy soil and many small nodules of obsidian are labeled as "small pile" in Figure 7-4. This small mound measures 1m by 1.5m and is 30cm in height. This small pile appears to be the result of recent excavation work and perhaps resulted in the exposure of the 5-15cm nodules currently visible in the pit.
History of study of quarry pit Q02-2
During a preliminary visit in 2002, I climbed to the Maymeja area using the description and GPS-derived UTM coordinates provided in Burger et al. (1998:205) where I spoke with a herder named Mattias Sarallasi who was working for the land owner from Callalli, Eliseo Vilcahuaman Pambra, and living in the estancia at the base of Maymeja. Sarallasi grabbed a shovel and led me up across the moraines past several small and shallow (1-2m diameter) quarry holes that he indicated to me, and finally to the Q02-2 quarry pit.
In Burger, et al. (1998:204) the authors write that in their 1995 visit Burger and Salas "encountered a local farmer who had been collecting quantities of obsidian from these deposits for future sale." Further, they note that "according to a local farmer, a German resident of Bolivia had visited this obsidian deposit in order to collect obsidian for export to La Paz where it was transformed into craft products". An initial concern for the Upper Colca Project was establishing that the extant pit was not the result of this modern quarrying in the Maymeja area. Directly datable materials were not located in the 2003 research to confirm the antiquity of the pit, but the integrity of the stratigraphy in the test unit, and the presence of cores and bifaces in the excavation, strongly suggest that the quarry pit feature is not a recent excavation. The conclusion here, based on the soil characteristics and the small quarry pits along the ridges below Q02-2, is that recent quarrying work was responsible for the small pile of light soil inside the q02-2 quarry, and for the small quarry pits downslope. The small pile encountered inside the quarry pit feature resembles the level 2 soil encountered in the test unit, suggesting that this modern quarrying entered at least as far as the stratum that was found 15cm below the surface in the 1x1m test unit.
The regional context of this quarry pit, including the relationship between the quarry pit, a Precolumbian road leading to the quarry, and other archaeological features, are described in Section 6.4.1. A discussion of the quarrying methods that may have been used at this location can be found in Ch..
Testing in the debris pile in 2003
In the course of the 2003 Upper Colca Project a 1x1m test unit was placed at Q02-2 in the debris pile immediately downslope of the quarry pit. The unit was aligned to true north and placed on the uphill side of the summit of the debris pile with the aim of bisecting the widest range sizes of pre-existing debris piles as the pile had accumulated below the quarry during ancient use. In the course of the test excavation, the team avoided filling the quarry pit feature with soil or other materials and instead positioned the backdirt piles and screened dirt on the south-east end of the quarry feature.
Figure 7-7. Diagram of Q02-2 quarry pit and position of the Q02-2u2 test unit relative to quarry debris layers and natural slope. By virtue of the quarrying history, levels are inverted in the 1x1m test unit so upper levels came from lower (earlier) levels in the quarry pit.
The quarry pit debris pile included relatively few culturally modified artifacts. While thousands of obsidian "flakes" with conchoidal fracture were encountered, closer inspection revealed that a very small minority were fractured by the human hand. Cortex is sometimes very thin on many of the flakes and nodules at the Chivay source (Section 4.5.1), which complicated the task of differentiating cultural and non-cultural flakes. Non-cultural flakes had no clear bulb or striking platform, or the geometry of the bulb was such that the force responsible for fracturing the rock was evidently far away and was geological in scale. In other words, one would see bulbs of percussion that appeared to have been initiated on adjacent rocks by geological or environmental processes, and the force of the fracture transferred through the obsidian matrix.
Figure 7-8. Q02-2, view of quarry pit and u2 test unit from the north.
Characteristics by level
While the test unit did not expose diagnostic artifacts or datable material, such as carbon, that would have facilitated identifying the culture group associated with the quarrying, it revealed changes in stratigraphy and material that contribute to understanding the prehistory of the Chivay source. Provisional estimates, based on comparisons with dates from the adjacent workshop test unit Q02-2u3, suggest that the bulk of quarrying at Q02-2u2 occurred in the Early Formative. It should be stressed here that because the test excavation is into a debris pile in Q02-2u2, levels are invertedso higher levels in the test unit came from lower in the Q02-2 quarry pit.
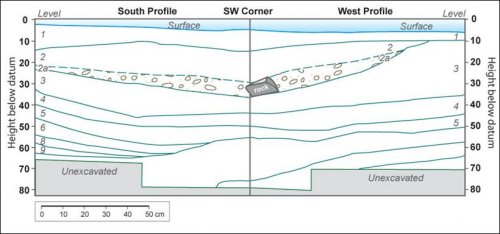
Figure 7-9. Q02-2u2 quarry pit south and west profile diagrams showing excavation levels.
Figure 7-10. South profile of Q02-2u2 at quarry pit at the top of levels 11/12.
The test unit Q02-2u2 stratigraphy indicates that episodic filling events occurred in this location. In the profile figure, excavation levels are represented approximately as indicated by strata lines. The profile photo (Figure 7-10) shows the south profile wall, therefore the quarry pit is located off of the left side of the photo frame. As expected, the stratigraphy generally slopes downwards towards the right. However, in level 2 and to a lesser extent in level 3 the stratigraphy levels out and even rises slightly, indicating there was major deposition on the quarry debris pile. These profiles suggest that the quarrying took place in two major episodes with what appears to have been some minor quarrying activity before and after each larger episode. The soil characteristics and artifact evidence provides more insights in to the circumstances surrounding the quarrying.
|
Level |
HBD* |
Comments / Interpret. |
Soil |
Photos #s |
|
1 |
5 |
Pale brown 10YR6/3, Sand, Fine grain, Poorly sorted, .5/.1 |
2010 |
|
|
2 |
15 |
Intensive quarrying |
Very pale orange 10YR8/2, Sand, Med grain, Poorly sorted, .7/.5 |
2014 |
|
2a |
21 |
Obsidian nodules ~7cm |
Concentration of larger nodules in v. light sandy soil. |
|
|
3 |
24 |
Intensive quarrying |
Light brownish grey 10YR6/2, Sand, Coarse grain, poorly sorted, .5/.5 |
2025 |
|
4 |
35.5 |
Pale brown 10YR6/3, Sandy loam, Fine grain, Poorly sorted, .5/.3.Ave grain size: .25, subangular to rounded. |
2026-2028 |
|
|
5 |
46.5 |
Very pale brown 10YR7/3, Sand, Fine grain, Poorly sorted, .5/.3.Ave grain size: .25, subangular to rounded. |
2029-2030 |
|
|
6 |
56 |
Increased moisture in soil, reduced frequency of larger obsidian pieces. |
Pale brown 10YR6/3,Sand, Med. grain, Poorly sorted, .7/.3.Ave grain size: .25-.5mm, subrounded. |
2030 |
|
7 |
59 |
Less obsidian, greater moisture. |
Pale brown 10YR6/3, Sand, Med. grain, Poorly sorted, .7/.3.Ave grain size: .5mm, subrounded. |
2031 |
|
8 |
66 |
Greater compaction, less rocky. Possibly entering natural slope. Small: .5-1mm, Med: 1-2mm |
Light yellowish brown 10YR6/5, Sand, Med. grain, Poorly sorted, .7/.3 |
2033-2036 |
|
9 |
69 |
Pale brown 10YR6/3, Sand, Coarse grain, Poorly sorted, .7/.7 |
2084-2085 |
|
|
10 |
72 |
Pale brown 10YR6/3, Sand, Coarse grain, Poorly sorted, .7/.7 |
2086 |
|
|
11 |
74 |
Pale brown 10YR6/3, Sand, Coarse grain, Poorly sorted, .7/.3 |
2087 |
|
|
12 |
85 |
Light brownish grey 10YR6/2, Sand, Fine grain, Poorly sorted, .3/.5 |
2090-2091 |
|
|
* HBD = mean height below datum in centimeters for the top of each level based on five depth measurements. |
||||
Table 7-7. Q02-2u2 Excavation levels from test unit at quarry pit. Excavation photos available online.
|
Level |
Flakes |
Cores |
Biface |
Ret'd Flake |
Preform |
Total |
|
1 |
6 |
6 |
||||
|
2 |
16 |
16 |
||||
|
3 |
8 |
8 |
||||
|
4 |
11 |
1 |
12 |
|||
|
5 |
13 |
1 |
14 |
|||
|
6 |
1 |
1 |
2 |
|||
|
7 |
2 |
2 |
||||
|
8 |
6 |
6 |
||||
|
10 |
7 |
1 |
1 |
9 |
||
|
11 |
10 |
10 |
||||
|
Total |
80 |
2 |
1 |
1 |
1 |
85 |
Table 7-8. Q02-2u2 lithic technical class by test unit excavation level.
The vast majority of obsidian fragments at Q02-2 were non-cultural in origin. The artifact data show that culturally derived flakes were found as low as level 11, and cores and retouched items were found in level 10. These data suggest that the quarry pit area was being exploited for obsidian production with in-situ production before it was being excavated on the scale of the later pit. The distributed nature of the cores, flakes, and retouched artifacts in a stratigraphic profile that is predominantly made up of excavation debris, points to a general focus on procuring whole nodules from this location.
|
Level |
Ob1 |
Ob2 |
% Ob2 |
Clear-Banded |
Clear |
Grey-Banded |
Grey |
|
1 |
4 |
2 |
33.3 |
1 |
2 |
2 |
|
|
2 |
16 |
0.0 |
4 |
4 |
2 |
5 |
|
|
3 |
8 |
0.0 |
2 |
2 |
1 |
2 |
|
|
4 |
11 |
1 |
8.3 |
3 |
4 |
1 |
3 |
|
5 |
12 |
1 |
7.7 |
5 |
5 |
1 |
1 |
|
6 |
1 |
0.0 |
|||||
|
7 |
2 |
0.0 |
1 |
||||
|
8 |
4 |
2 |
33.3 |
2 |
4 |
||
|
9 |
0.0 |
||||||
|
10 |
9 |
0.0 |
1 |
5 |
2 |
||
|
11 |
10 |
0.0 |
3 |
4 |
2 |
1 |
|
|
Total |
77 |
6 |
7.2 |
19 |
27 |
9 |
20 |
Table 7-9. Q02-2u2 quarry pit obsidian artifact material type and color by level.
A principal question concerning the ancient excavation of the quarry pit is: why excavate for obsidian when it is available on the surface? What desirable characteristics of subsurface obsidian justify the effort expended in digging this quarry pit? Here, the consistency and visual qualities of the obsidian artifacts excavated from Q02-2u2 are examined in order to determine if there were patterns in those characteristics of the material. As shown in Table 7-9, Ob2 obsidian accounted for 7.2% of the artifacts analyzed from the test unit at Q02-2u2, which is comparable to the ratio of projectile point use in the project overall where just 7.8% of the obsidian projectile points observed in the course of 2003 fieldwork were produced on Ob2 obsidian.
|
Color of obsidian |
Artifacts from Q02-2u2 |
All Obsidian Projectile Points from 2003 Fieldwork |
||
|
Clear |
27 |
36.0% |
43 |
35.3% |
|
Clear_Banded |
19 |
25.3% |
23 |
18.9% |
|
Grey |
20 |
26.7% |
35 |
28.7% |
|
Grey-Banded |
9 |
12.0% |
21 |
17.2% |
|
Total |
75 |
100.0% |
122 |
100.0% |
Table 7-10. Q02-2u2 Color in quarry pit artifacts compared with all obsidian projectile points from fieldwork.
These data indicate that obsidian from the quarry pit had variability in color of material that was comparable to obsidian use over the entire region. In other words, quarrying individuals at the Q02-2 quarry in the past could expect a relatively low percentage of Ob2 material and color distributions that are consistent with the percentages used for tool production. However, as obsidian was acquired from a number of surface sources, the material quality and color of obsidian from the Q02-2 quarry pit does not appear to have been a principal motivation for excavating in that location. It appears that the quarry pit was relatively typical of the tool characteristics in the region.
However, a difference in cortical flake size from the quarry pit was noted.
|
Flake Length in mm |
|||||||
|
Level |
10 - 20 |
20 - 30 |
30 - 40 |
40 - 50 |
50 - 60 |
60 - 70 |
Total |
|
1 |
1 |
1 |
2 |
||||
|
2 |
1 |
2 |
1 |
3 |
7 |
||
|
3 |
1 |
1 |
2 |
||||
|
4 |
1 |
1 |
2 |
1 |
5 |
||
|
5 |
4 |
4 |
|||||
|
8 |
2 |
2 |
|||||
|
10 |
1 |
2 |
1 |
4 |
|||
|
11 |
1 |
1 |
2 |
||||
|
Total |
1 |
3 |
11 |
6 |
6 |
1 |
28 |
Table 7-11. Q02-2u2 quarry pit: Lengths of flakes and cores with >20% cortex.
Because production appears to have been largely conducted elsewhere, the counts for cortical flakes are relatively low. The pattern here suggests that larger nodules were available in deeper in the quarry. Again, levels are invertedin the test unit because the excavation is into a secondary debris pile (Figure 7-7), so higher levels in the 1x1m test unit came from lower levels in the original Q02-2 quarry. It appears that there was an abundance of large nodules and limited flaking was occurring later in the use of the quarry, and therefore larger flakes were being discarded. In a later discussion below, these data are compared with data presented in Table 7-26, from test unit Q02-2u3 at the A03-126 quarry workshop, in order to explore the connection between the quarry pit and the workshop.
A natural slope has been estimated from the surface map created using a total station in 2004 (Figure 7-7). Subtracting the surface map elevation from the calculated natural slope elevation at the location of the Q02-2u2 test unit allows for an estimate of depth at which one would encounter the sterile natural slope in the excavation unit.
|
Surface elevation |
- |
Natural slope |
= |
Depth of |
|
4980.10 |
- |
4979.27 |
= |
0.83 |
Table 7-12. Calculated depth of strata in Q02-2u2.
This independent calculation is confirmed by the Q02-2u2 excavation because sterile soil was encountered at approximately 85 cm depth. Based on the thin strata in the test unit profile, it appears that quarrying in this location was initially low-intensity, but that two episodes of large scale quarrying appear to have occurred in level 3, and especially level 2, of the strata profile which correspond to later episodesin the history of the quarry pit.
7.4.2. Q02-2, Test Unit 3
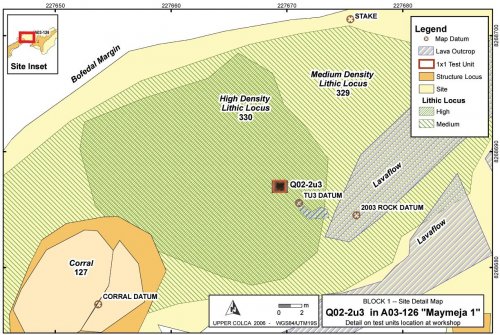
At the closest habitable area to the quarry pit, the Maymeja workshop was identified. At this workshop, located downslope of the quarry pit, a 1x1m test unit was placed in the highest part of a gentle mound sloping gradually from the warm, sheltered foot of the cliff band to the edge of the bofedal (see context description in Section 6.4.1). This location, 600m downslope to the west of the quarry pit Q02-2, represents the closest location for stone working adjacent to quality grazing and a perennial water source. While the Chivay source Maymeja workshop [A03-126] is modest in size compared to obsidian workshops elsewhere in the world, many of the same analytical and sampling challenges were encountered that have been faced by researchers at larger workshops. The goal of this study was to document variation in reduction strategies and to attempt to determine if the variation was linked to cultural, temporal, or behavioral changes at the workshop. To be clear: the Q02-2u3 test unit is located inside of the site A03-126 workshop in a high density lithic locus labeled A03-330.
The Maymeja workshop at the Chivay source consisted primarily of flakes and cores, but a small fraction of other artifact types were found here. In the abundance of flakes and cores it may be estimated that the 1x1m unit, with a mean depth of 72cm, produced approximately 750 kg of cultural debris. As was discussed in Chapter2, a basic challenge of workshop studies is in capturing variability through the proper balance of sampling and detailed measures of artifact characteristics.
The 2004 lab analysis included taking several dozen measures on 1,544 artifacts from this pit alone (Section 5.7.2), and the focus was predominantly on analyzing complete flakes and complete cores. The principal morphological changes could be observed in the most well-represented technical classes by summarizing results and also by using clustering techniques and Principal Components Analysis on numerical measures.
Change through time at the workshop
The environmental context of the workshop area on the south side of Maymeja has several characteristics commonly associated with residential base camp sites and these environmental features appear to have contributed to the concentration of obsidian production activities that occurred in this area. These site characteristics include perennial water nearby, grazing, long hours of direct sunlight with a relative abundance of shelter providing partial protection from wind.
The artifactual evidence from the A03-126 workshop, bracketed by three 14C dates between the Terminal Archaic and the Middle Formative, suggest that there were three principal episodes of activity at the workshop. First, in the early history of the workshop obsidian knappers took advantage of relatively large obsidian nodules that were apparently available in Maymeja. Next, the production pattern shifted and long, narrow obsidian cores of Ob1 material became abundant. Subsequently, after a brief ambiguous phase that perhaps reflected the exploitation of residual materials from the preceding stage, there was return to a pattern that is similar to the earliest occupation levels in terms of flake morphology and technical class variability. These episodes can be interpreted as demonstrating (1) initial local, irregular production, (2) intensive procurement and production that perhaps involved larger scale quarrying, (3) a return to irregular production and occasional quarrying. This evidence will be explored below.
Figure 7-11. Location of test unit Q02-2u3 in site A03-126 workshop.
Q02-2u3 Descriptive Characteristics by Level
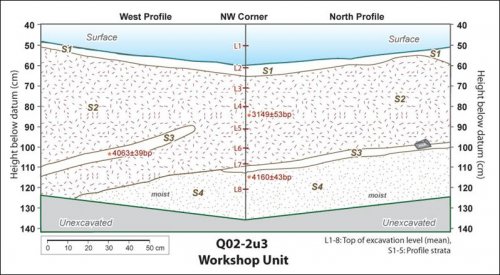
The stratigraphy at the Maymeja workshop contains layers at two distinct angles that suggest that mounding occurred initially downslope of where the mound is located today. The Q02-2u3 test unit measured only 1x1m and provided little spatial evidence for architectural interpretation, but the yellow surface labeled as S3 is suggestive of some kind of prepared surface associated with obsidian production at the workshop. Radiocarbon samples recovered from levels 4, 6, and 7 indicate that the sequence in this test unit spans the middle of the Terminal Archaic through to the Early/Middle Formative and probably well into the Middle Formative. A soil sample examined by UC Santa Barbara volcanologists from level 6 contained grains of biotite and hornblende but these grains may have derived from the older bedrock (Sarah Fowler, pers. comm., 27 Feb 2006). The sampling strategy during excavation at the obsidian source involved collecting 25% of flakes being excavated per level by retaining flakes from a single quad, while carbon samples, cores and retouched artifacts (most of which were presumably observed by the excavator) were collected from throughout the 1x1m unit. Thus, flake counts and weights are proportionally ¼ of the amount of other artifact types collected from the Q02-2u3 excavation.
Figure 7-12. Q02-2u3 workshop test unit west and north profile diagrams showing strata.
Figure 7-13. Q02-2u3 west profile at Maymeja workshop site [A03-126].
|
Lvl |
HBD* |
Contents |
Soil |
Photos #s |
|
1 |
51 |
S1 Strata. 1 projectile point. |
Dark brown 7.5YR3/2, Silty loam, Med grain, poorly sorted, .7/.7 |
243 |
|
2 |
62 |
S2 |
Dark greyish brown 2.5YR4/2, Sand, Coarse grain, poorly sorted, .9/.5 |
244-245 |
|
3 |
72 |
S2 |
F1; Dark brown 7.5YR4/2, Silty sand, Medium grain, poorly sorted, .9/.5 |
246-249 |
|
4 |
81 |
S2.14C: 3149±53bp |
Dark brown 10YR3/3, Silty loam Fine grain, well sorted, .3/.7 |
N950:250-251 N4100: 2329-2330 |
|
5 |
93 |
S2,S3. Midden with yellow stains. Floor surface? |
Dark yellowish brown 10YR3/4, Silty clay, Fine grained, well sorted, .3/.7 |
252-253 |
|
6 |
101 |
S3, S4: midden, F4&F5: depression on west edge, poss postmolds. Charcoal. S314C: 4063±39bp |
Dark yellowish brown 10YR3/4, Silty loam Fine grain, well sorted, .3/.7. Grains of biotite and hornblende encountered in soil sample. |
254-256 |
|
7 |
108 |
Charcoal, Moist soils. Fewer lithics. S414C: 4160±43bp |
Dark greyish brown 10YR4/2, Silty loam, Fine grain, poorly sorted, .5/.7, F2: Dark yellowish brown, Silty loam, 10YR3/4, Fine grain, poorly sorted, .5/.7 |
258-259 |
|
8 |
122 |
Very moist, poss. altitude of bofedal.. Near sterile. |
Brown 7.5YR4/3, silty sand, Med grain, poorly sorted, .7/.3 |
258-259 |
|
* HBD = mean height below datum in centimeters for the top of each level based on five depth measures per level. |
||||
Table 7-13. Q02-2u3 Excavation levels from test unit at the A03-126 workshop.
As with other units in Maymeja, TU3 consisted of almost exclusively obsidian artifacts in a matrix of tephra-rich soils. As would be expected at a workshop site, there was a great deal of redundancy both in material types and technical classes. Hammerstones were not found in abundance in the excavation, but cores made a large contribution to the assemblages in most levels. This is considerably more than are encountered in consumption sites. For example, in all 13 levels in the test unit A02-26u1 (Taukamayo) only 15 cores were found.
Figure 7-14. Proportions of Tech Classes in excavation levels by count in Q02-2u3.
|
Lvl |
Biface |
Core |
Flake |
Flake Retouched |
Total |
||||||
|
No. |
Wt.(g) |
No. |
Wt.(g) |
No. |
Wt.(g) |
No. |
Wt.(g) |
No. |
Wt.(g) |
||
|
1 |
No. and Wt. |
3 |
31 |
59 |
1484.1 |
151 |
765.2 |
6 |
73.7 |
219 |
2354 |
|
Std. Resid. |
-1.2 |
1.1 |
-.4 |
.2 |
|||||||
|
2 |
No. and Wt. |
7 |
52.4 |
49 |
1218 |
151 |
699.4 |
4 |
29 |
211 |
1998.8 |
|
Std. Resid. |
.5 |
0 |
0 |
-.6 |
|||||||
|
3 |
No. and Wt. |
13 |
100.5 |
70 |
2703.4 |
279 |
602.1 |
2* |
60.2 |
364 |
3466.2 |
|
Std. Resid. |
1.0 |
-1.6 |
1.2 |
-2.4 |
|||||||
|
4 |
No. and Wt. |
9 |
60.1 |
94* |
2915.4 |
205 |
998 |
11 |
209.9 |
319 |
4183.4 |
|
Std. Resid. |
.1 |
2.3 |
-1.5 |
1.0 |
|||||||
|
5 |
No. and Wt. |
6 |
60.9 |
54 |
1500.8 |
187 |
558.7 |
7 |
71.2 |
254 |
2191.6 |
|
Std. Resid. |
-.3 |
-.7 |
.4 |
.2 |
|||||||
|
6 |
No. and Wt. |
2 |
15.5 |
8 |
306.3 |
55 |
406.4 |
7** |
33.3 |
72 |
761.5 |
|
Std. Resid. |
0 |
-2.1 |
.5 |
3.9 |
|||||||
|
7 |
No. and Wt. |
1 |
18 |
582.3 |
50 |
618.7 |
1 |
9.7 |
70 |
1210.7 |
|
|
Std. Resi. |
-.7 |
.4 |
0 |
-.6 |
|||||||
|
Total |
No. and Wt. |
41 |
320.4 |
352 |
10710.3 |
1078 |
4648.5 |
38 |
487 |
1509 |
16166.2 |
Table 7-14. Q02-2u3:c2showing Technical Class by Level with the Standard Residual.
The variety of technical classes by level is shown above, with very significant counts of retouched flakes in level 6, and significantly low counts of retouched flakes in level 3. There are also a significantly high number of cores discarded in level 4. The weight of these assemblages is also important because, for example, while the count is high in level 3 the weight is relatively low as the assemblage consists of many small flakes. The thickness of each layer (HBD in Table 7-13) can be compared with weight.
Nominal Attributes of obsidian raw material in the quarry test unit: Color, Cortex Type, Heterogeneities
An examination of obsidian by color per excavation level, and color by rotations as a measure of investment but discard, reveals that grey and black obsidian artifacts had the greatest number of rotations while clear and clear-banded obsidian, while making up over 50% of the obsidian present, was seldom rotated more than twice. A number of researchers have observed that Chivay obsidian is unusually transparent. Yet, this evidence indicates that grey and black obsidian was predominant in certain levels at the workshop and these artifacts were rotated more extensively.
|
Q02-2u3 Obsidian Characteristics by Level |
|||
|
Level |
Prevalent |
Rare |
Comments |
|
1 |
Color:Grey; Cortex:Irregular, Tabular |
Color:Black; Cortex:Tabular Rounded |
|
|
2 |
Color:Brown Banded, Grey Banded |
Color:Black |
|
|
3 |
Color:Clear |
Color:Grey, Grey Banded. Cortex:Tabular |
|
|
4 |
Color:Black, Grey, Grey Banded Cortex:Tabular |
Color:Clear |
|
|
5 |
Color:Black, Clear; Cortex:Tabular Rounded |
Color:Grey, Grey Banded |
|
|
6 |
Color:Clear Banded |
Cortex:Tabular Rounded |
|
|
7 |
Color:Clear; Cortex:Tabular Rounded |
Ob2 (9%) |
|
Table 7-15. Attributes of obsidian artifacts from Q02-2u3.
In the course of the analysis, Alex Mackay noted the presence of Kombewa flakes (Schick and Clark 2003;Tixier, et al. 1980), also as known as "Janus flakes", in analysis. This a flake-as-core technique where
(1) A relatively large flake, Flake A, is struck from a core.
(2) Flake A then becomes Core A when a flake is struck from the ventral surface of Flake A removing the bulb of percussion from step 1 as a thinning technique and producing Flake B.
(3) Flake A is a Kombewa core, and the Flake B that results from step 2 is a Kombewa flake that has bulbs of percussion on both sides.
|
Level |
Kombewa Flakes |
% Flakes |
Total Flakes |
|
1 |
0 |
149 |
|
|
2 |
0 |
151 |
|
|
3 |
4 |
1.45 |
276 |
|
4 |
1 |
0.49 |
204 |
|
5 |
6 |
3.21 |
187 |
|
6 |
0 |
53 |
|
|
7 |
0 |
43 |
|
|
Total |
11 |
1.03 |
1063 |
Table 7-16. Proportion of Kombewa flakes by level in Q02-2u3.
The Kombewa core is a flake that is thinned by this process, and the Kombewa flake that is produced is small and triangular. Mackay observed that a number of series 5 projectile points had vestiges of a bulb of percussion on one of the proximal tangs on one side, and a bulb of percussion in the middle of the piece on the other side, which suggests that it was produced on a Kombewa flake. The only other location where Kombewa flakes were encountered in significant quantities was on the surface of the site of Collpa [A03-910] in Block 5 midway between the Chivay source and Callalli. Seven Kombewa flakes (6 of obsidian, one of chert) were encountered on the surface at Collpa. A number of series 5 points were also encountered at Collpa.
Further examination of Q02-2u3 "workshop" sequence
Fluctuations in the presence of particular stone artifact types in the excavation test unit at the Maymeja workshop provides insights into changing reduction activities at the workshop area through time. As described above, radiocarbon dates for the unit place the lower parts of the excavation in the Terminal Archaic, while the middle of the sequence (around level 4) falls at the Early / Middle Formative transition. As was reviewed in Chapter 3, these are times of interest in terms of obsidian distributions throughout the region.
Shifting production for export at the source
Diachronic changes evident from the 2003 testing at the workshop suggest that shifts in production occurred that were consistent with the development and decline of an obsidian production system responding to the demands of regional consumption. It can be inferred from changing flaked stone artifacts at the workshop that a local production regime was replaced with an approach maximizing flake blanks for export that persisted for a time and, subsequently, shifted into biface production strategy, prior to reverting to a local production. This sequence of events occurs in the Terminal Archaic and Early Formative just as obsidian frequencies regionally reach their apex (e.g., at Qillqatani, see Figure 3-7). The evidence of these shifts appear in retouched artifacts, in cores, and in the changing morphology of complete flakes at the workshop test pit.
This in depth analysis involves an investigation of diachronic change in three separate groups of lithic artifacts. First, retouched flakes are briefly compared with bifaces. Next, multivariate analysis is used on cores to investigate changes across time. Finally, saving the best for last, the attribute analysis for 1063 complete flakes from the test unit is presented that reveals changes in reduction strategies and complementing the evidence from cores, bifaces, and retouched flakes.
Bifaces and Retouched Flakes
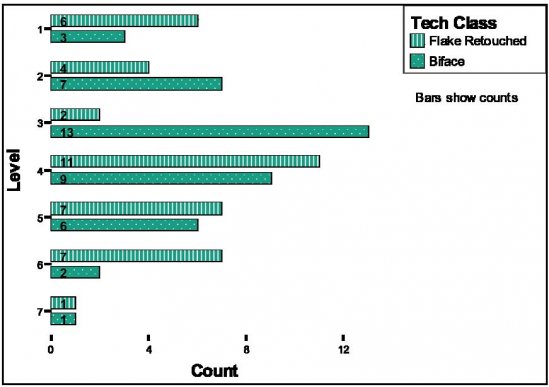
Changes in the frequencies of bifaces and retouched flakes by excavation level, though relatively few in number, are one indicator of diachronic changes in production, and a notable pattern in these variables emerges from the 38 retouched flakes and 41 broken bifaces found in the workshop unit. The Q02-2u3 unit contained predominantly broken bifaces in level 3, and a statistically significant decline (a< .05) in relative prevalence of retouched flakes when comparing level 6 to level 3 in the workshop.
Figure 7-15. Retouched artifacts by Excavation Level.
As this is a workshop production site, not a consumption context, formal artifact classes are of limited utility in discerning changes in activities taking place. Notable changes appear to have occurred between level 4 and level 3. These inferences are reinforced by excavation data presented earlier (see section above "Q02-2u3 Descriptive Characteristics by Level"), where the high discard of cores in level 4 switched to a low discard of retouched flakes in level 3. Further detail into reduction trajectories by level requires investigating cores and flakes discarded at the workshop.
Cores
A very high number of cores were recovered from the 1x1 m workshop test unit (n = 352) and these cores were classified using the strict definition that the cores have not a single positive percussive feature. In the excavated sequence at Q02-2u3, cores show a distinct standardization in production between level 5 and level 4, a change in reduction strategy in level 3, and finally in the upper most levels 1 and 2 the pattern reverts to characteristics similar to that observed in the lowest levels.
|
Level |
Obsidian |
Rotations |
Total |
|||||||
|
Ob1 |
Ob2 |
0 |
1 |
2 |
3 |
4 |
5 |
|||
|
1 |
No. |
57 |
2 |
15 |
21 |
15 |
6 |
2 |
0 |
59 |
|
% Lvl |
96.6% |
3.4% |
25.4% |
35.6% |
25.4% |
10.2% |
3.4% |
0% |
100% |
|
|
2 |
No. |
46 |
3 |
18 |
20 |
4 |
6 |
1 |
0 |
49 |
|
% Lvl |
93.9% |
6.1% |
36.7% |
40.8% |
8.2% |
12.2% |
2.0% |
0% |
100% |
|
|
3 |
No. |
65 |
5 |
31 |
25 |
11 |
2 |
0 |
0 |
69 |
|
% Lvl |
92.9% |
7.1% |
44.9% |
36.2% |
15.9% |
2.9% |
0% |
0% |
100% |
|
|
4 |
No. |
90 |
4 |
25 |
31 |
24 |
10 |
3 |
0 |
93 |
|
% Lvl |
95.7% |
4.3% |
26.9% |
33.3% |
25.8% |
10.8% |
3.2% |
.0% |
100% |
|
|
5 |
No. |
53 |
1 |
26 |
17 |
7 |
3 |
0 |
0 |
53 |
|
% Lvl |
98.1% |
1.9% |
49.1% |
32.1% |
13.2% |
5.7% |
0% |
0% |
100% |
|
|
6 |
No. |
7 |
1 |
1 |
3 |
0 |
1 |
1 |
0 |
6 |
|
% Lvl |
87.5% |
12.5% |
16.7% |
50.0% |
.0% |
16.7% |
16.7% |
0% |
100% |
|
|
7 |
No. |
15 |
3 |
4 |
3 |
3 |
3 |
2 |
2 |
17 |
|
% Lvl |
83.3% |
16.7% |
23.5% |
17.6% |
17.6% |
17.6% |
11.8% |
11.8% |
100% |
|
|
Total |
No. |
333 |
19 |
120 |
120 |
64 |
31 |
9 |
2 |
346 |
|
% Lvl |
94.6% |
5.4% |
34.7% |
34.7% |
18.5% |
9.0% |
2.6% |
0.6% |
100% |
|
Table 7-17. Cores at Q02-2-u3 by excavation level showing counts and proportions of Ob1 and Ob2 material and rotations.
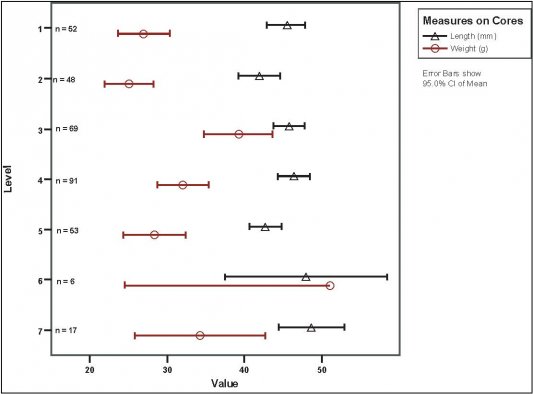
Figure 7-16. Q02-2-u3 Cores by Level showing changes length and weight.
These patterns can be summarized as follows. First, in the early levels, such as in basal level 7, large nodules were available and they were knapped more extensively, and then the cores were discarded while they were still relatively large in size, particularly if they were made of Ob2 obsidian. Rotations:In these earlier levels a high proportion of cores were rotated extensively, showing conservation behavior. Ob2 obsidian:three cores (16%) in level 7 contained heterogeneities. Some of these cores had a relatively high number of rotations, with three rotations on an Ob2 core in level 7 and there were four rotations on a lone Ob2 core from level 6. It appears that the presence of bubbles and other heterogeneities was a less significant deterrent to production in the early levels of workshop activity.
Subsequently characteristics of intensification and decline were observed in middle and upper levels of Q02-2u3. Discarded cores became increasingly more ovate through the intensification period of levels 5 through 3 (see Figure 7-16), where weight increased without a concurrent increase in length. Higher up, in level 2, the mean weight of cores plummeted by 15 grams. These changes in the morphology of discarded cores suggest that more detail on size variability among cores could shed light on the processes at work. These multivariate patterns can be illuminated through cluster analysis.
Cluster Analysis with Cores
Using the cluster analysis of cores from the workshop test unit, a few groupings of cores emerge from clustering on six variables. These more general groupings permit the examination of changes in core attributes in terms of types that reflect the underlying variability in the dataset.
Cluster analysis is a classification method that arranges a set of cases into clusters that are more similar to each other than they are to cases from other clusters (Aldenderfer 1982;Shennan 1997:234-258). The values from six ratio and scale variables of 334 complete obsidian cores from Q02-2-u3 workshop test unit were examined using hierarchical cluster analysis. Hierarchical clustering produces nested clusters with increasing variance within clusters as one ascends the cluster hierarchy.
Cores were clustered by first exploring different clustering methods on the Z scores of following measures: Weight, Length, Medial Width, Medial Thickness, Rotations, and Percent of Cortex. The four common hierarchical clustering methods: Single Linkage, Complete Linkage, Average Linkage and Ward's Method were conducted. This exploration revealed that regardless of the method selected, three cluster solutions were most commonly observed in the clustering agglomeration schedules. Three clusters generated by a Complete Linkage clustering solution provide the tightest clusters with measures on cores. Complete Linkage clustering, also referred to as "Maximum" and "Furthest-Neighbor" Method, is an approach where the dissimilarity between two groups is equal to the greatest dissimilarity between a member of cluster 1 and a member of cluster 2. Complete Linkage clustering tends to produce tight clusters of similar cases and the algorithm delays including new members in a cluster; furthermore, it does not tend to produce chaining.
|
Function |
||
|
1 |
2 |
|
|
Weight (g) |
.803* |
.537 |
|
ThickMed (mm) |
.723* |
.109 |
|
% Cortex |
.476* |
-.366 |
|
Rotations |
-.304 |
.654* |
|
WidthMed (mm) |
.193 |
.514* |
|
Length (mm) |
.264 |
.486* |
|
* Largest absolute correlation between each variable and any discriminant function. |
||
Table 7-18. Canonical discriminant function for Q02-2u3 Cores.
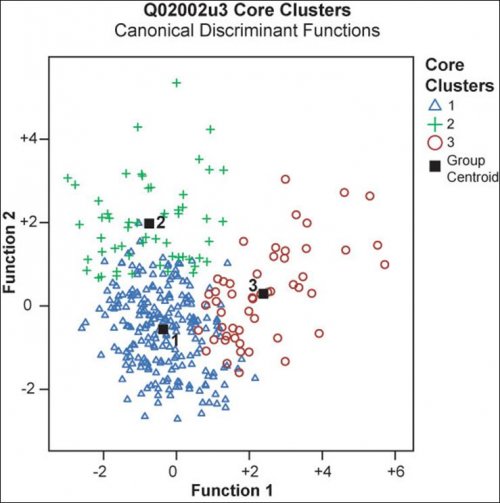
Clusters derived from cores are expressed in two discriminant functions shown in Table 7-18. This table shows the structure matrix for cores in order of size of correlation. Function 1 describes core sphericity using the Weight and Thickness measures, while Function 2 describes tabular shaped cores (Width and Length) with high Rotations.
Figure 7-17. Canonical discriminant chart for core clusters from Q02-2u3.
The variables were standardized using Z scores so that they had a mean of 0 and a standard deviation of 1, which has the result of regularizing measures like Percent Cortex (ranging from 0-100%) so that they cluster more effectively against the values of measures like Medial Thickness (ranging from 0.5 to 34cm). A description of the morphology of these three core clusters will be followed by an examination of the relative frequencies across levels.
Cores were clustered into three groups with low eigenvalues and relatively proportional counts in each cluster. An inspection of the clustering measures across the three groups revealed that the three clusters described three types of cores that were apparent during the lithic analysis.
Figure 7-18. Boxplots showing three clusters of Q02-2u3 cores with size measures. The tabular shape of C2 cores is apparent in their thinness relative to their length and width.
|
Characteristics of Three Core Clusters from Q02-2u3 |
|||
|
C1(n=226) |
C2(n=56) |
C3(n=52) |
|
|
Size |
Light, short, narrow cores that started on small nodules. |
Mid-weight, and long and wide, but as thin as C1 cores. |
Heavy, long, wide, and very thick. Ovate in shape. From larger nodules relatively unreduced. |
|
Cortex and Rotations |
Moderate amounts of cortex, moderate number of rotations on large number of cores. |
Virtually no cortex and high number of rotations on cores. |
High amounts of cortex, few rotations. |
|
Ob2 Fraction |
Few (n=10), or 4%. |
Moderate (n = 8), 14% |
None (n=0) |
|
Comments |
Smaller initial nodules. |
Started on large nodules, and most heavily reduced. |
Sampled but discarded early. |
Table 7-19. Q02-2-u3 characteristics of three clusters from core attributes.
Did these clusters of cores result from intrinsic characteristics of three types of starting nodules, or are the clusters the result of reduction strategies and the particular reduction history of that core? C2 cores, for example, appear to have started as "tabular cores" but following some reduction they were discarded at the workshop despite being fairly large.
There is little correlation between clusters and attributes of the material such as Ob2 (hetereogeneous), cortex type, or color and banding characteristics. C1 and C2 cores separate easily into two groups: the C1 consisting of small cores and C2 with long, narrow cores that were heavily reduced. However, the cluster 3 (C3) cores are more enigmatic because they were discarded relatively early in the reduction sequence and these cores are evident throughout the sequence the workshop so the reason for their discard is not immediately obvious.
Figure 7-19. An example of a C1 core [L03-162.303], arrows indicate percussion.
Figure 7-20. An example of a C2 core [L03-162.305].
Figure 7-21. An example of a C3 core [L03-162.280] showing a small area of thin cortex.
Raw material availability and the opportunities for reduction in the particular reduction trajectory of a given core appear to determine the cluster in which a discarded core is categorized using this system. Following this logic, if the abundance beginning in Level 5 is due to quarrying work at the quarry pit, 600m up the slope, then additional large nodules would have become available from this quarry and with increased raw material availability, larger cores were discarded at the workshop during this time of abundance.
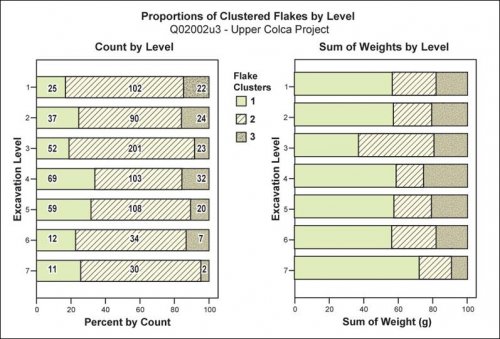
Figure 7-22. Clustered Cores from Q02-2u3 workshop test unit showing counts by level.
Changing proportions of these clusters of cores between levels, particularly between levels 5 and 2, suggests that there was a changing availability of raw material. A distinctive pattern emerges that centers on level 4 as the probable apex of production of large flake blanks for export from the workshop. In level 4 there are a relatively large number of C2 cores with 3 or 4 rotations and yet they are over 50mm long and appear to have been discarded far earlier than would have occurred in other levels in the workshop. The varying counts and weights of these clusters evident in Figure 7-22 show a peak in large, cortical cores (C3) in level 5 that are replaced by heavily reduced tabular cores (C2) in level 4, and finally both groups give way to an increase in counts of small, moderately retouched cores (C1) in level 3.
The presence of quantities of C2 cores in Level 4 is particularly intriguing because the discard of cores with little cortex (and thus heavily worked), yet still evidently long and tabular, suggests that very large cores were abundant in this phase. By level 3 the C2 cores were replaced by the smaller C1 cores that are moderately reduced, which are taken to mean that large cores were no longer available and surpluses of large cores remaining in the system from earlier times had been consumed. The most parsimonious explanation for this abundance of large, tabular C2 cores in level 4 is that a new source of obsidian were being exposed through labor investment in quarrying in the vicinity of the workshop. A14C date from level 4 calibrates to between 1500 - 1380 BCE, or the end of the Early Formative, precisely when obsidian is most abundant at consumption sites like Qillqatani (discussed in Section 3.4.2).
Cores compared with Cortical Flakes
Measuring changes in the maximum size of obsidian nodules over time is complicated by the fact that cores become smaller through use. If cores are the subject of export then one can compare the maximum length of early stage reduction cortical flakes (where dorsal cortex ? 50%) with the maximum length of cores as an indicator of the maximum possible size of cores during a given period. However, if large flake blanks are being further reduced and/or exported then large flakes will not be discarded at the workshop and core length may exceed cortical flake length.
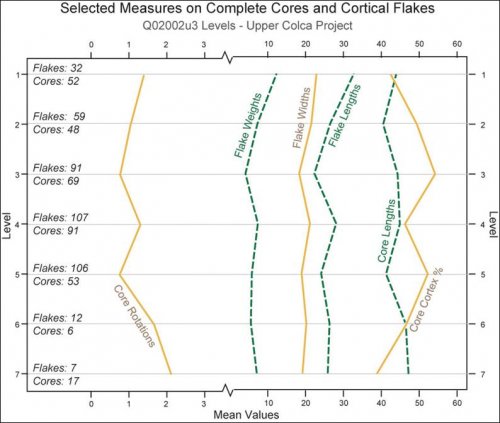
Figure 7-23. Q02-u3: Graph showing means of complete cores and cortical flakes.
First, consider the mean values of cores and cortical flakes across excavation levels in their aggregate. The differences between excavation levels using the measures displayed in Figure 7-23 are extremely significant using an ANOVA test of variance.
|
Tech. Class |
Measure |
df |
F |
Signif. |
|
Cores |
Length (mm) |
6 |
2.589 |
.018* |
|
# Rotations |
6 |
6.241 |
.000*** |
|
|
% Cortex |
6 |
3.834 |
.001*** |
|
|
Flakes |
Length (mm) |
6 |
7.168 |
.000*** |
|
Width (mm) |
6 |
4.529 |
.000*** |
|
|
Weight (g) |
6 |
5.968 |
.000*** |
Table 7-20. Q02-2u3: ANOVA on complete cores and flakes with at least 50% dorsal cortex.
In Table 7-20 the observed differences in means are extremely significant ( p? .001) except for the means of core lengths which are significant ( p< .018), confirming that the variability presented in Figure 7-23 is meaningful. The variability in means suggests that specific measures should be investigated in more detail across excavation levels. Changes in means by level on complete cores and cortical flakes as a whole are shown in Figure 7-23 where notable fluctuations on a variety of independent measures that converge around level 4 can be observed.
These differences by level show the relationship between discarded large cores and the cortical flakes that were struck from them. The measures Flake Lengths and Core Lengths show that mean core lengths exceed flake lengths by about 10 cm. The relative decrease of long cortical flakes in level 3, despite the continued availability of long cores, suggests that there was an export of long, heavily reduced cores and large flakes; artifacts that were probably exported as flake blanks.
The absence of cortex on smaller flakes is useful for discriminating advanced reduction flakes from small flakes that simply derived from small cores. Small flakes are abundant in level 3 (as will be shown later below in Figure 7-24) and means in non-normal distributions are sensitive to skewing. One may ask "is the sheer number of smaller flakes in level 3 from more advanced reduction activities, as demonstrated by the presence of broken bifaces in level 3 (discussed earlier), skewing the mean and lowering the mean length of flakes?"
The Pearson's r correlation coefficient between Length and the Percentage Cortex variables is strong on complete flakes from both level 3 and 4, but it is extremely strong in level 4. In level 3 there is a strong correlation between Length (X) and Percentage of Dorsal Cortex (Y) ( r= .203, p= .001, Y = .79X + 19.06). In level 4 the correlation between Length (X) and Cortex (Y) is extremely strong ( r= .330, p= <.0005, Y = 1.16X + 22.89). Evidently flakes got smaller in level 3 even when they contained significant dorsal cortex coverage, supporting the argument that larger cores were less available in level 3 than they were in preceding levels.
These changes in core morphology support earlier patterns that were observed in the distribution of retouched flakes and bifaces in levels 4 and 3 (see Figure 7-15). Recall that the retouched flakes that were prevalent in level 4 are largely replaced by bifaces in level 3 when smaller cores are dominant and procurement of large, tabular C2 cluster cores appears to be curtailed. These data from cores corroborate the data from bifaces and retouched flakes. Further evidence comes from a detailed examination of the last group of artifacts from the Q02-2u3 test unit to consider, the most well-represented group at the workshop: unretouched complete flakes.
Complete Flakes
Measures on 1063 complete obsidian flakes from the obsidian workshop test unit provides evidence of changing activities through time that support the observations made on cores and retouched artifacts. Flakes will be examined first through the mean values on their numeric attributes.
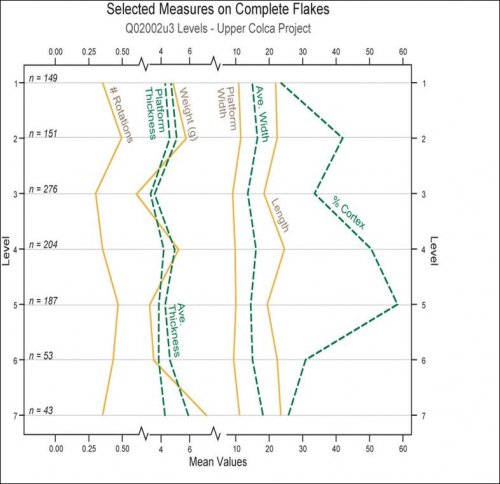
Figure 7-24. Q02-2u3: Graph showing means of measures on complete obsidian flakes.
The mean values of flake measures length, average width, average thickness, weight, platform width, platform thickness, percentage of dorsal cortex, and count of rotations were presented. The average width and average thickness variables were calculated by averaging the Proximal, Medial, and Distal measures for Width and Thickness on each flake.
|
Measure |
df |
F |
Sigif. |
|
Length (mm) |
6 |
9.392 |
.000*** |
|
WidthAve (mm) |
6 |
7.290 |
.000*** |
|
ThickAve (mm) |
6 |
9.431 |
.000*** |
|
PlatWidth (mm) |
6 |
2.344 |
.030* |
|
PlatThickness (mm) |
6 |
2.358 |
.029* |
|
Weight (g) |
6 |
7.707 |
.000*** |
|
% Cortex |
6 |
18.819 |
.000*** |
|
# Rotations |
6 |
2.914 |
.008*** |
Table 7-21. Q02-2u3: ANOVA on measures from complete flakes.
The observed differences in means are extremely significant ( p? .001) except for the means of platform width and platform thickness, which are merely significant ( p< .05). While mean values across levels are highly subject to skewing due to overrepresentation by the numerous small flake categories, the data in Figure 7-24 demonstrate that the large sizes associated with level 4 cores discussed previously are repeated in the flakes from level 4.
In Figure 7-24, the percent cortex variable shows a notable spike in level 5 but this variable should be considered in conjunction with the weight variable because by weight and size these highly cortical flakes are relatively small. Looking at the percent cortex in level 7, in contrast, one can see that there is little cortex and a mean weight of 8 grams indicating relative abundance and relatively wasteful reduction at the workshop. These large level 7 flakes appear to have come from large cores because they are comparably heavy, wide, and thick, and the flakes are not very cortical. This changes rapidly in level 6 as mean weight goes down despite a slight increase in corticality. The number of rotations similarly points to more efficient decortication in level 5 with thinner, shorter flakes that are relatively cortical. Level 3 rotations are low, although this is perhaps a product of the small overall size of these flakes hence rotations are less visible on the smaller surface.
Platform characteristics are important determinants of flake morphology (Dibble 1997;Dibble and Pelcin 1995;Shott, et al. 2000) and can point to changing reduction strategies because platform attributes directly convey changes in knapping decisions in terms of point and angle of force. Platform characteristics show intriguing relationships with other flake characteristics, but the patterns are difficult to explore in the aggregate. As with multivariate analysis in cores above, the patterns discussed in flake morphology in the workshop test unit can be further explored using cluster analysis.
Cluster analysis on Complete Flakes
Cluster analysis of flakes from the Q02-2u3 pit elicits groupings from the numerical variables taken on complete flakes, and provides a way of reducing the dimensionality of the flake morphology dataset without the limitations of typological classification of flakes. Thirteen numerical measures were gathered on complete flakes and when these thirteen were included in the cluster analysis it was apparent that ten of the measures were related variables because they were measures that reflect overall flake size. As a consequence, the clustering solutions that emerged, regardless of the clustering method employed, tended to reflect the size groupings of smallest, medium, and largest measures in most attributes. A reduction of dimensionality was needed to collapse these correlated size measures into fewer variables so that a second order of variability in attributes that were not size dependent could emerge. Dimensionality can be reduced by conducting a Principal Components Analysis on the data prior to clustering, and then clustering the components with Eigenvalues of approximately 1 or higher.
Clustering the results of Principal Components Analysis (PCA) has precedence in archaeology going back to the 1970s (Ahler 1973;Redman 1973). In this study, the thirteen variables were first reduced to four PCA components and, subsequently, a Ward's Method clustering derived a 3 cluster solution from these 4 components. The numerical measures on complete flakes submitted to Principal Components Analysis include: weight, length, proximal width, medial width, distal width, proximal thickness, medial thickness, distal thickness, platform width, platform thickness, platform angle, percent cortex, and number of rotations. Mean values were substituted for empty values in the PCA. In this study, four PCA components with eigenvalues greater than 0.988 were clustered accounting for 75% of the variability in the dataset. Next, these four components were entered into a cluster analysis.
A variety of hierarchical clustering methods were explored and the most appropriate clustering solution appeared to be Ward's Method where three clusters were derived with a minimum of internal variance. In Ward's Method, cluster membership is assessed by calculating the total sum of squared deviations from the mean of the cluster. By maintaining the smallest possible values for the error sum of squares then intracluster variance is minimized and intercluster variance is maximized.
|
Function |
||
| 1 |
2 |
|
|
Plat Thickness |
.571* |
.094 |
|
Plat Width |
.546* |
.079 |
|
Width Prox |
.528* |
.202 |
|
Plat Angle |
-.493* |
.252 |
|
Thick Prox |
.411* |
.297 |
|
% Cortex |
.297 |
.705* |
|
Weight (g) |
.208 |
.452* |
|
Thick Med |
.324 |
.451* |
|
Thick Dist |
.153 |
.424* |
|
Length |
.164 |
.394* |
|
Width Med |
.305 |
.345* |
|
Width Dist |
.107 |
.309* |
|
Rotations |
.006 |
-.060* |
|
* Largest absolute correlation between each variable and any discriminant function |
||
Table 7-22. Canonical Discriminant Function Structure Matrix in order of size of correlation.
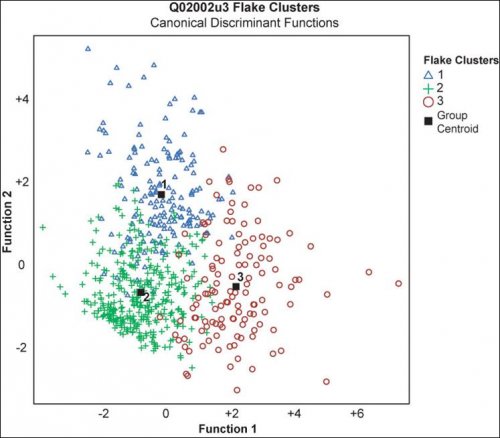
Figure 7-25. Canonical discriminant chart for complete flake clusters from Q02-2u3.
In Table 7-22, the contribution of each of the different measures taken on flakes to the two functions that emerge from cluster analysis are shown. Function 1 responds to platform characteristics, the morphology of the proximal parts of each flake, and flakes with tapering widths. Function 2 primarily responds to the variables that reflect the overall size, cortex, and rotations measures of each flake.
This clustering solution brings out the variability by excavation level among flakes in Q02-2u3 that were discussed above. Broadly speaking, the clusters discriminate large cortical flakes from small, non-cortical flakes, but a third group, differentiated primarily by its platform characteristics, also emerged from the analysis.
|
Characteristics of Three Flake Clusters from Q02-2-u3 |
|||
|
F1(n=265) |
F2(n=668) |
F3(n=130) |
|
|
Size and Platform |
Longest flake class, and slightly heavier than F3 class. Includes the greatest size variability. |
Smallest flakeswith the smallest platforms and moderate platform angle. |
Moderately large flakes with very large platformsand very acute platform angles. Tapering significantly proximal to the distal. Slight tendency for faceting as a form of platform preparation. |
|
Cortex, Rotations, Terminations |
Significantly more cortex than other clusters but only slightly fewer rotations. Many plunge terminations, few hinge. |
Significantly little cortex. Few rotations. The most hinge terminations, fewest plunge. |
Moderate amounts of cortex, slightly more rotated than other clusters. |
|
Ob1 vs Ob2 |
Some Ob2. (n=14), 5.3% |
Few Ob2. (n=20), 3.0% |
Few Ob2.(n=5), 3.8%. |
|
Comments |
Largest flake class. These flakes are conceivably serving as blanks. |
Smallest class of flakes and advanced reduction flakes. |
Possibly corner removal flakes on tabular obsidian nodules. |
Table 7-23. Q02-2-u3: characteristics of 3 clusters of flakes based on numerical attributes.
Figure 7-26. An example of a flake from the F1 cluster [L03-162.21].
Figure 7-27. An example of a flake from the F2 cluster [L03-162.118].
Figure 7-28. An example of a flake from the F3 cluster [L03-162.66].
These clusters capture much of the variability present in the flakes from Q02-2u3. Patterns among nominal attributes of these clusters are also worth examining. Non-numerical attributes could not be submitted to the PCA and clustering functions directly because only quantitative measures can be used with that procedure. Nominal attributes, such as flake termination, must be addressed using analyses measures of association such as Standard residuals and Cramer's V.
|
Flake Cluster |
Termination |
||||
|
Feather |
Hinge |
Plunge |
Step |
||
|
1 |
No. |
166 |
20 |
62 |
13 |
|
Std. Residual |
-.3 |
-4.0* |
5.0* |
1.0 |
|
|
2 |
No. |
431 |
154 |
59 |
22 |
|
Std. Residual |
-.2 |
3.0* |
-2.8* |
-.6 |
|
|
3 |
No. |
93 |
18 |
14 |
5 |
|
Std. Residual |
.9 |
-1.2 |
-.6 |
.0 |
|
Table 7-24. Q02-2u3:c2showing types of terminations by flake cluster. On the whole, these relationships are not very strong (Cramer's V = .171).
In Table 7-24 standard residuals point to significant differences in the cluster 1 and 2 proportions of hinge and plunge terminations. In this table, a significant difference exists where ever the standard residual exceeds 1.96. However, on the whole, the table relationships are not very strong because the Cramer's V for the table is just 0.171. The proportions of hinge and plunge terminations are notably different between F1 and F2. The high number of plunges in F1 might be explained by these flakes serving as decortication flakes where plunging terminations can serve to clear off the bottom of the core to improve the chances of achieving feather terminations in subsequent blows. As a core maintenance strategy, plunging terminations can improve subsequent flaking events by increasing the striking angle. Furthermore, when the end of the core is non-cortical it increases the chance of feather terminations.
Other platform attributes of these flake clusters include an unusually high incidence of faceting on the platforms of F3 flakes. This kind of platform preparation is sometimes used to remove cortex or inconsistencies from the platform area. Furthermore, ac2table showed that Platform Angle, the distinctively low attribute of F3 flakes, is the variable with strongest association with the three cluster classification (Cramer's V = .457).
Interpretation with an Investigation of Flake clusters by Excavation Level
Investigating the proportions of these flake clusters by excavation level provides insight into the changing activities at the Maymeja workshop. A graph showing the proportions of these clusters by level will be shown and discussed in detail beginning with the oldest strata, the Terminal Archaic level 7 (2880-2650 BCE).
Figure 7-29. Graph showing Flake clusters by excavation level.
Level 7- Basal level
A high proportion of F1 flakes by weight was in keeping with expectations concerning early use of the workshop area. Early reduction of widely available large cores resulted in a large number of F1 flakes. The F3 flakes in this level had relatively acute platform angles.
Level 6- Large Platformed Flakes (F3)
An increase in F3 by count and weight in level 6 that persisted through later levels in the unit hints at a change in reduction strategy that produced these large platformed flakes. The defining characteristics of these flakes, are large platforms with very low dorsal platform angles, and these are very pronounced in this level within the F3 group. In reviewing the core clusters by level from Figure 7-22, there are few cores in this level and a relative prevalence of small cores, suggesting a decrease in availability of the large cores found in other levels. The production system that was dominant in level 7 had perhaps been altered by level 6 for lack of raw material in large nodules.
Level 5 -Core export level.
This level maintained roughly the same proportions of F1, F2, and F3 flakes, but the overall flake counts were much higher. In other words, a pattern that began in level 6 developed into full-fledged production strategy in level 5 because the proportions suggest that similar activities were being preformed but with higher production rates. The F2 flakes had significantly smaller platform thicknesses, a characteristic that fluctuated greatly between levels. The F2 flakes also had more rotations and they had much more cortex than F2 flakes did in higher, later levels. This suggests that smaller cores were being decorticated in level 5. Revisiting the core proportions from Figure 7-22, it is notable that large C3 cores dominated the assemblage of discarded cores in this level, despite the evidence from the flakes that small cores were in use. Hence, it appears that certain cores were decorticated and exported and therefore such cores appear in reduced frequency in this level.
A notable increase in the number of bifacially retouched flakes and broken bifaces is apparent in level 5, indicating that a pattern of some more advanced reduction activities was underway during these levels. There is also a slightly higher representation of Ob2 material among F3 flakes in this level.
Level 4 -Large flake blank production level
In general, production patterns first witnessed in level 5 continued at a higher rate in level 4. A14C sample from this level had a radiocarbon date from the Early/Middle Formative transition (1500-1320 BCE). The large F1 flakes had significantly more rotations while F2 flakes had fewer rotations. F2 flakes also had thicker platforms in this level, particularly contrasting with thin platforms on F2 flakes in the surrounding levels 3 and 5. All cores had significantly more rotations than in preceding and succeeding levels (see Figure 7-23), and this was particularly true of the tabular C2 core cluster. There was a slight increase in C2 cores in this level. These data indicate that further rotations were being applied, and that large tabular C2 cores, which were heavily decorticated and thus must have been extremely large to start with, were being discarded in abundance in this level. The level 4 excavation strata was also unusually thick (13.9 cm), therefore proportions are comparable to other levels while the actual count are not directly comparable. One significant difference between level 5 and level 4 is the presence of large cortical flakes in level 4, as shown in Figure 7-23.
Level 3 - Advanced reduction
Level 3 was distinguished because it contained a far greater number of small flakes and cores than did previous and subsequent levels. It was mentioned above that evidence of advanced reduction in level 3 included the discard of 13 broken bifaces yet only 2 retouched flakes were discarded. The many small flakes in this excavation level resulted in much higher artifact densities. Among the F1 flakes the lengths and weights were lower, while among F2 flakes the lengths were significantly longer, and among the F3 flakes weight dropped significantly. Thus, flakes in all 3 clusters shifted towards the smaller ends of their size categories. There were twice as many F2 flakes in level 3 than in previous levels, and they had low platform thickness, few rotations, and had significantly less cortex than did previous levels.
Cores in level 3 primarily consisted of large C3 cores that essentially replaced the C2 cores in this level. The lack of C2 cores suggests that the cores were either being further knapped, or they were being transported away through export during this occupation level.
The evidence from level 3 is consistent with workshop activities that had shifted from initial reduction to more advanced stages of reduction. The absence of large cortical flakes and large tabular C2 cores suggests that the investment in procurement that was supplying the cores to the workshop had changed,and perhaps excavating at the quarry q02-2 had ceased. As this is a workshop area with a long history of use, scavenging could have continued for many years as relatively large cores and flakes were surely extant in the workshop area. It appears that the system was essentially well-stocked in the beginning of level 3 but it appears that by the end of level 3 the easily available, knappable obsidian was relatively depleted.
Level 2 - Returning to production
Cores and flakes in level 2 return to a larger size scale. There were relatively few broken bifaces compared to retouched flakes. There are additional rotations on both F1 and F2 flakes, and F2 flakes had very little cortex and high platform thickness values. A return to quarrying at the q02-2 quarry is one possible explanation for the higher availability of material in these levels. In level 1, the F1 flakes are significantly rotated and some of the obsidian has notable quantities of irregular cortex.
Connection to the quarry pit
An important question remains concerning the history of the Q02-2 quarry pit that lies 600m uphill to the east of the workshop. Due to a lack of datable materials or diagnostic artifacts in the quarry pit test unit Q02-2u2, it was not possible to directly link excavation levels at that unit with activities and excavation levels at the workshop test unit Q02-2u3 on a temporal basis.
If large nodules were being transported from the quarry to the site of A03-126 where they were being reduced, the morphology and visual characteristics of cortical flakes in Q02-2u3 may reflect this import of cores from the quarry pit up the hill. These tables can be compared with data presented earlier in Table 7-9 and Table 7-11 from the quarry pit test unit.
|
Material Quality |
Color of obsidian |
||||||||
|
Level |
Ob1 |
Ob2 |
% Ob2 |
Brown- Banded |
Black |
Clear- Banded |
Clear |
Grey- Banded |
Grey |
|
1 |
215 |
7 |
3.15% |
1 |
2 |
66 |
104 |
7 |
39 |
|
2 |
206 |
6 |
2.83% |
2 |
3 |
42 |
115 |
28 |
20 |
|
3 |
349 |
18 |
4.90% |
10 |
106 |
219 |
10 |
17 |
|
|
4 |
301 |
18 |
5.64% |
25 |
68 |
126 |
33 |
60 |
|
|
5 |
250 |
9 |
3.47% |
19 |
61 |
162 |
7 |
8 |
|
|
6 |
69 |
3 |
4.17% |
2 |
26 |
27 |
2 |
10 |
|
|
7 |
65 |
6 |
8.45% |
5 |
20 |
23 |
7 |
12 |
|
|
Total |
1455 |
67 |
4.40% |
3 |
66 |
389 |
776 |
94 |
166 |
Table 7-25. Q02-2u3: Obsidian type and color of artifacts by level.
|
Length in mm |
|||||||
|
5-19 |
20-39 |
40-70 |
|||||
|
Level |
No. |
% |
No. |
% |
No. |
% |
Total |
|
1 |
10 |
16.7 |
22 |
36.7 |
28 |
46.7 |
60 |
|
2 |
26 |
28.0 |
44 |
47.3 |
23 |
24.7 |
93 |
|
3 |
58 |
39.7 |
43 |
29.5 |
45 |
30.8 |
146 |
|
4 |
26 |
15.8 |
85 |
51.5 |
54 |
32.7 |
165 |
|
5 |
57 |
38.3 |
61 |
40.9 |
31 |
20.8 |
149 |
|
6 |
4 |
25.0 |
9 |
56.3 |
3 |
18.8 |
16 |
|
7 |
3 |
23.1 |
2 |
15.4 |
8 |
61.5 |
13 |
|
Total |
184 |
28.7 |
266 |
41.4 |
192 |
29.9 |
642 |
Table 7-26. Q02-2u3: Length of complete flakes and cores with ?50% cortex.
In comparing these data with the tables discussed earlier from the Q02-2u2 quarry test unit, no specific pattern is apparent that decisively links the quarry pit with the workshop downslope. An increase in Clear and Clear-Banded obsidian becomes visible in level 3 of the workshop (q02-2u3), in Table 7-10 shown above, that could reflect a sudden availability of this material from excavation at the quarry pit provided that the quarry pit is the sole source of this clear and clear banded obsidian. However as mentioned, the quarry pit is probably not the sole source of clear obsidian because it contains proportions of clear obsidian that reflect tool use over the entire region. There was concurrently a decrease in other colors of obsidian in level 3. No discrete pattern was observed in the Ob1 vs Ob2 material type linking the two pits. Finally, the length of cortical flakes indicates that dramatically more long flakes were deposited at the source from level 5 onwards, as discussed earlier, but there were also notably more medium and small cortical flakes in those levels as well.
7.4.3. Summary Interpretation of A03-126 Workshop
The evidence from the workshop area is being interpreted here through the following sequence of events. During the earliest phases of obsidian procurement the archaeological surface data (Ch. 6) suggest that the Maymeja area of the Chivay obsidian source was visited irregularly in an embedded procurement strategy that brought mobile foragers into the Maymeja area. Evidence for the use of the Maymeja area itself during the Middle Archaic comes from projectile points, but procurement in the Maymeja area probably only occurred in a context that was embedded in subsistence activities by local or near local residents.
In the middle of the Terminal Archaic Period, at approximately 2800 BCE and a time of increased intensification on the pastoralist economy, the Maymeja workshop area became occupied more consistently and debitage began to accumulate on the edges of the bofedal in this area. Flaked stone artifacts from these lower levels (levels 6-7) provide evidence of relatively advanced reduction because the cores found in the lowest level of the workshop test unit contained a high count of rotations and the cores had little cortex remaining on the exterior despite the fact that the cores were fairly large. The artifacts found in these levels suggest that the source area had a sufficient abundance of large obsidian nodules, and that relatively large cores were discarded readily when they did not provide sufficiently large flakes to suit the knapper.
Subsequently, the assemblage at the workshop changed and with the increased quantities and regularity of flake and core morphology at the workshop it appears that the quarrying activities at q02-2, a quarry pit 600 meters to the east, occurred during this time. The evidence (levels 4-5) points to an intensified processing of obsidian in the form of tabular obsidian nodules of primarily Ob1 obsidian material. The dramatic increase in production coincides with a peak in frequencies of Chivay obsidian at sites throughout the Titicaca Basin consumption zone to the east and the south of the Chivay source. Evidence from the workshop suggests that the obsidian was processed and exported in the form of flake blanks and bifacially reduced tabular cores.
Regularity in reduction strategies in these levels can be inferred from the morphology of discarded items. While the abundance of production in levels 5 and 4 is evident from high rates of discard and strata thickness, there is relatively low variability in artifact class and form. Very low levels of advanced reduction were occurring, but a persistent minor quantity of retouched flakes and bifaces was found. On the whole, however, the assemblage is dominated by large but heavily rotated cores, and the discard of large flakes. It can be inferred that in other levels large cores and flakes would have been rejuvenated or some how recovered, but in these levels of regularized production, such items that did not conform to the production aims of the workers were simply discarded. A small proportion of flakes in these levels were "Kombewa flakes" (Table 7-16), a technique that results from the flake-as-core technique of using large flakes as cores, and removing the percussion bulb with a perpendicular thinning strike.
Sometime after 1400 BCE (level 3 and higher) this intensified production activity for regional export ended and reduction activities at the workshop returned to local provisioning. The morphology of cores and flakes at this point shifts dramatically and more advanced and variable reduction occurred at the workshop. It appears that the surplus from an earlier stage of intensified obsidian production was exploited in this later time as the cores and other available materials were much further reduced. On top of this sequence is a final phase of lower intensity production from the Late Formative and onward that resembles the earliest phase at the workshop both in density of lithic debitage and in technical class variability.
In sum, changes over time at the workshop suggest a sequence beginning with local exploitation of the source. This was followed by an intensified period of production that corresponds with increased distribution and consumption regionally. It appears that large flake blanks and mid-sized cores were being exported in these levels. Finally with the collapse of this production system for regional export it appears that locals were taking advantage of surplus material that remains in the system for local reduction and provisioning. The upper most levels at the workshop indicate that lower intensity use of the area and variable reduction strategies dominated the activities at the workshop.
