4.1.1. Climate across the study area
The Colca valley is located in the western cordillera of Andes in a semiarid climate that is cool and unpredictable. As a high altitude region of tropical latitude, diurnal temperature variation is more prominent than annual temperature variation (Denevan, et al. 1987;Troll 1968). Precipitation is highly seasonal, however, and it is changes in rainfall and availability of pasture that strongly influence the scheduling and intensity of pastoralism and dry land agriculture throughout the study area. The south-central Andes is a region south of 15° S latitude, outside of the Intertropical Convergence Zone, and precipitation is relatively unpredictable with high interannual variability because it results largely from the convection of humid air from the Amazon Basin to the east (Johnson 1976). The western slope of the Andes thus lies in a rain-shadow, and warm, dry winds from the east result in low average annual precipitation as one descends the western flanks of the Andes. In the ecotone that is the Upper Colca study area the herding economy thrives, because these communities can seasonally exploit the rich pasture lands and greater rainfall of the high puna while simultaneously interacting with the communities and products of the main Colca valley, communities to which they may have family linkages.
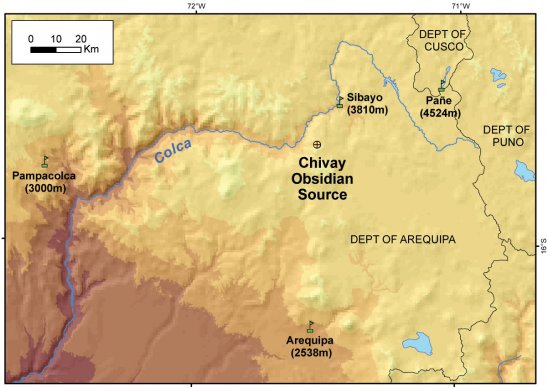
Of the major obsidian sources in the Andes, the Chivay obsidian source is the highest elevation source and the environmental conditions in the area during prehispanic procurement visits to the source are the subject of some speculation. Annual climatic variability under modern conditions at the Chivay source can be inferred from the relationship between altitude and temperature, known as the lapse rate, and this rate may be calculated using records from nearby meteorological stations. A mass of rising air will cool at the dry adiabatic lapse rate that is often estimated as 0.98° C per 100m of ascent for dry conditions, while the saturated adiabatic lapse rate is typically 0.5° - 0.6° C per 100m at dew point when temperatures are around 10°C (Adiabatic lapse rate 1999). This theoretical lapse rate may be compared with empirical temperature data reported by the ONERN environmental investigation, a regional study of the entire Majes-Colca drainage that preceding the construction of the Majes hydroelectric project. These data include mean monthly temperature records from meteorological stations at Pañe near the Colca headwaters, Sibayo on the northern edge of our Upper Colca study area, and the mid-altitude stations of Arequipa and Pampacolca (ONERN 1973;WMO 2006).
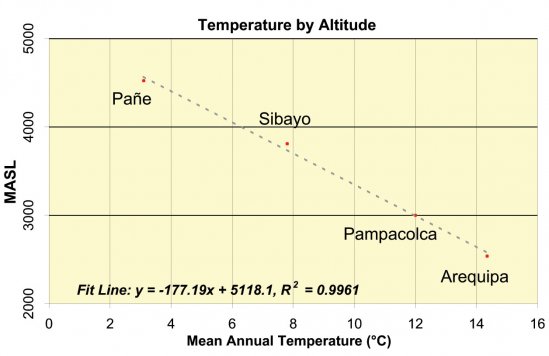
Figure 4-3. Temperature by Altitude at mid- and high-altitudeArequipa meteorological stations. All data from ONERN (1973) except Arequipa values from W.M.O. (2006). These data represent a lapse rate of -0.56°C per 100m of ascent.
These empirically-derived mean annual temperature values from the Arequipa sierra show a lapse rate of -0.56°C per 100m, which is in the range of the standard saturated adiabatic lapse rate of -0.5 to -0.6 per 100m, discussed above, from which can be inferred a mean annual temperature of 0.8°C at the Chivay obsidian source. Given the aridity of this region much of the year, the relatively low-slope (saturated) lapse rate is unexpected and the raw tabular data in the ONERN report suggests that a more detailed examination of the data will better allow the temperature variation at the Chivay obsidian source to be inferred.
Models based on local meterological data
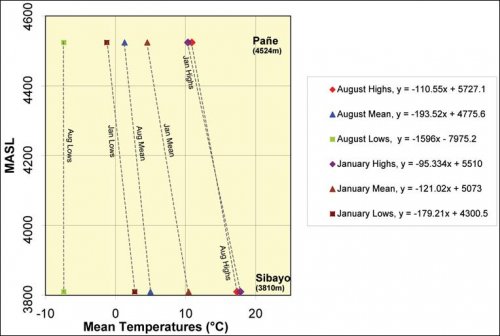
Monthly mean temperature data collected from 1952 - 1970 at local meteorological stations show highs, daily means, and lows, and the considerable differences from the lapse rate function that probably result from the dramatic diurnal temperature variations and the relatively thin atmosphere in this region. The seasonal effects on lapse rate can be considered by looking more closely at data from the nearest reliable weather stations, at Sibayo and Pañe.
Figure4-4. Comparison of Temperature highs, means, and lows for August and January from two meteorological stations with records kept between 1952-1970(ONERN 1973).
|
August (winter, dry) |
January (summer, rainy) |
||||||
|
Altitude |
Lows |
Mean |
Highs |
Lows |
Mean |
Highs |
|
|
Sibayo |
3810 |
-7.4 |
5.0 |
17.3 |
2.7 |
10.4 |
17.8 |
|
Pane |
4524 |
-7.8 |
1.3 |
10.9 |
-1.2 |
4.5 |
10.3 |
|
Maymeja |
5000 |
-10.2 |
1.0 |
6.6 |
-3.6 |
0.6 |
5.6 |
|
Temp. Change / 100m |
-0.5 |
-0.1 |
-0.9 |
-0.5 |
-0.8 |
-1.0 |
|
Figure 4-5. Mean monthly temperatures (°C) from data in ONERN (1973). Inferred temperatures at the Maymeja area of the Chivay obsidian source shown in italics.
Figure4-6. Precipitation by Altitude (left), precipitation in the study area (lines represent highs, averages, and lows) is highly seasonal as shown in 14 yr precipitation record from Sibayo on right. Data from ONERN (1973).
The local relationship between altitude, temperature, and precipitation on the dry western slopes of Arequipa are evident in these data derived from tables provided by ONERN (1973, Appendix II). Diurnal temperature variation, highest during the dry winter months of July, August, and September results in a steep lapse rate such that low temperatures in Sibayo, near the lowest part of the study area, are only 3° C warmer than those mean winter lows at the Chivay source. Curiously, the high temperature values cross over between summer and winter months (
Figure4-4) resulting in somewhat more of a temperature difference between Sibayo and Pañe during the rainy summer months than the winter months, probably reflecting the higher precipitation at altitude. As most precipitation, including snowfall, comes during the summer months of January and February, greater cloud cover and reduced solar insolation at altitude are expected during the summer months.
At the Chivay obsidian source the inferred temperature values are in keeping with observations made during the course of research at the source in August and September 2003, as will be discussed below. This is not to suggest that the modern climate regime existed during prehispanic times, but these relative contrasts in temperature and precipitation values throughout the Upper Colca study area probably have existed throughout the Holocene although actual precipitation and temperatures varied from those of the modern conditions. Paleoclimatic reconstructions from the Terminal Pleistocene and through the Holocene using data from cores collected in large lakes and glaciers were discussed in Chapter 3.
It is important to stress that adiabatic lapse rate temperature estimates do not account for other important factors affecting local climate such as local insolation, vegetative cover, and wind, as well as temperature contrasts due to solar heating where the atmosphere is thin, and temperature inversions in mountain valleys (uncommon at tropical latitudes). Further, orographic effects such as mountain and valley winds have specific and localized effects in the Upper Colca survey blocks. Seasonality in the upper Colca region includes rain and snowfall in the highest reaches during the wet summer months as well as a high incidence of lightning strikes (a major cause of death in the Peruvian highlands today). Modern herders in the Colca area adapt to these conditions by distributing their impacts and exploiting the high altitude resources primarily during the dry season.
The equatorial bulge in barometric pressure
An issue related to temperature variation is the presence of an equatorial bulge in atmospheric pressure as one ascends to high altitude (Ward, et al. 2000: 26-28;West 1996). In low latitude areas, barometric pressure at a given altitude is correspondingly higher than is pressure at that altitude in mid and high latitude areas of the world.
|
Figure4-7. Latitude against barometric pressure (West 1996). Lines show altitude in km. Annual temperature seasonality is minimal in the equatorial areas and thus seasonal effects at low latitudes are not shown in this graph. |
Models of variance in barometric pressure with latitude at a given altitude based on data derived primarily from weather balloons explain why there is greater available oxygen at 5000m in low latitude areas than in high latitude areas. The differences in pressure are particularly notable during high latitude winters.
|
Altitude |
15° latitude |
60° latitude, summer |
60° latitude, winter |
Equivalent Altitude |
|
4000 |
475 |
462 |
445 |
3479 |
|
5000 |
419 |
406 |
387 |
4400 |
|
6000 |
369 |
356 |
335 |
5310 |
Table 4-2. Equatorial bulge and effects on barometric pressure (in torr) at 15° and 60° latitude. From data in (West 1996: 1851). Equivalent altitude column shows altitude at 60° latitude with equivalent pressure to the value shown at 15° latitude.
As shown in Figure 4-7 and Table 4-2, the equatorial bulge in pressure means that the available oxygen at the Chivay source at 5000 masl is only close to the pressure that of a location nearly 1000m lower if the source were located at 60° latitude (in winter). In other words, during the winter at 60° latitude, at approximately the latitude of Anchorage Alaska, one would have to be at only 4400 masl altitude to find available oxygen at levels equivalent to that found at 5000 masl at the Chivay source. Barometric conditions similar to those found near the summit of Nevado Ampato at 6000 masl can be found in winter at 5310 masl near Anchorage, AK. The high altitude Chivay source is not as inhospitable as would be this zone at the equivalent altitude in higher latitude areas. Resource patches, such as rich bofedal grazing areas, are sufficient to draw seasonal or permanent residents to these altitude zones in the Andes. Raw material sources, particularly mining operations, are another significant draw to high altitude locations both in past and in modern times (Ward, et al. 2000: 336-344).


